
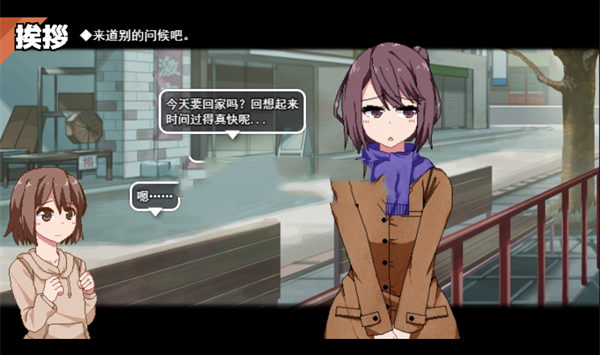
游戏截图
父亲失踪、前女友无缘无故地与他分手后,一个男人留下了什么?一颗空虚的心,过着单调的日常生活。"遇见你改变了我的世界。" 这场命运般的邂逅让我们故事的主人公平濑达也卷入了一件可能震撼整个国家甚至世界的事情。 游戏特色与亮点 新天域是一款以剧情为核心的视觉小说游戏,玩家将扮演平濑达也,在失去父亲和前女友后重新寻找人生意义。游戏拥有精美的角色立绘和丰富的剧情分支,每个选择都会影响故事的发展方向。 游戏最新版本包含约1300张全新CG渲染图,23个新增动画场景,以及全新的音乐和音效系统。玩家可以体验到绫濑、美晴、千夏和加穗等角色的全新剧情内容,每个角色都有独特的性格和故事线。 剧情介绍与角色 故事的主人公平濑达也在经历人生低谷时,遇到了能够改变他世界的女孩们。这场命中注定的相遇将他卷入了一个可能震撼整个国家甚至世界的巨大秘密之中。玩家需要通过与不同角色的互动,逐步揭开主人公失踪父亲背后的真相。 绫濑 (Ayase) 温柔善良的女孩,拥有治愈人心的力量 美晴 (Miharu) 活泼开朗的少女,总是充满正能量 千夏 (Chika) 神秘的女孩,似乎隐藏着重要的秘密 加穗 (Kaho) 成熟稳重的女性,给人安全感 游戏采用多线程叙事结构,玩家的每个选择都会影响与角色的关系发展,进而改变整个故事的走向。通过精心设计的对话系统和事件触发机制,玩家可以体验到真正个性化的游戏剧情。

核心特性
探索游戏的强大功能
版本控制完整
游戏版本持续更新维护
性能优化极致
底层引擎深度优化调校
系统高度集成
模块化架构无缝整合
操作秘籍
掌握核心玩法技巧
V0.1
夜露死苦 會議 1 —
● 我什麼都不想要
綾瀨好感度 +1
● 變貓咪然後用貓貓語道歉
綾瀨好感度 +2
解鎖綾瀨未來的「貓咪角色扮演」事件
妹妹遭遇 —
● 我請她幫忙當服飾模特兒
綾瀨好感度 +1
● 她就喜歡這種衣服
無好感度
與綾瀨、優花和千佳的晚餐約會 —
● 準備收拾回家了
無好感度
● 我陪妳走回去吧
優花好感度 +1
千佳好感度 +1
幫派代號 —
● 鴞
幫派代號「鴞」
● 黑
幫派代號「黑」
● 笨蛋
幫派代號「笨蛋」
血月街頭遭遇 —
● 低位單打
無改變
● 射後不理
無改變
V0.1結束
最大可能綾瀨好感度 = 3
最大可能優花好感度 = 1
最大可能千佳好感度 = 1
V0.2
海灘時間:神奇寶貝選擇 —
● 黑澤 / 山田 / 川崎
無改變
海灘時間:美晴防曬大作戰 —
● 幫美晴塗防曬
解鎖美晴「友情支線事件」
● 做其他活動
無事件
海灘時間:活動 —
● 蓋沙堡 / 玩水 / 打西瓜
無改變
相信誰 —
● 相信綾瀨 → 綾瀨好感度 +1
● 相信惠惠 → 無好感度
● 買飲料(完成所有活動後解鎖)→ 推進劇情
海灘時間:美晴小互動 —
● 選擇「你」 → 美晴好感度 +1
● 八重咲 / 輝夜 → 無好感度
海灘時間:美晴料理 —
● 吃她的料理 → 美晴好感度 +1
● 去買食物 → 無好感度
海灘時間:美晴救貓大作戰 —
● 讓她安心 → 美晴好感度 +1
● 沉默 → 無好感度
海灘時間:香帆和巧克力 —
● 分兩半 → 無事件
● 直接咬 → 解鎖未來「香帆零食事件」
保護綾瀨(限時選擇) —
● 護著她 → 解鎖綾瀨未來支線劇情,綾瀨好感度 +1
● 什麼都不做 → 無事件
V0.2結束
最大可能綾瀨好感度 = 5
最大可能美晴好感度 = 3
最大可能優花好感度 = 1
最大可能千佳好感度 = 1
最大可能香帆好感度 = 0
V0.3
關心綾瀨狀況 —
● 關心她 → 綾瀨好感度 +1
● 給她點空間 → 無好感度
真希課間小遊戲 —
● 是 → 真希友情事件(解鎖綾瀨額外劇情)
● 不 → 無事件
美晴貓耳互動 —
● 摸 → 美晴好感度 +1
● 不 → 無好感度
優花宵夜時刻 —
● 是 → 優花好感度 +1
● 直接回家 → 無好感度
與千佳共飲 —
● 跟她一起喝 → 繼續千佳路線
● 保持沉默 → 千佳路線結束
● 回應她 → 千佳好感度 +1,繼續路線
進一步互動 —
● 忍耐住 → 千佳好感度 +2
● 睡覺 → 千佳路線結束
美晴偷聽:地平說 —
● 不行 → 美晴不安 +1
● 棒 → 美晴自信 +1
美晴偷聽:個性 —
● 溫柔甜美 → 美晴不安 +1
● 風趣愛玩 → 美晴自信 +1
美晴偷聽:時間 —
● 日久生情 → 美晴自信 +1
● 新鮮感 → 美晴不安 +1
如果美晴不安 >= 2 → 解鎖美晴「傷心事件」
如果美晴自信 >= 2 → 解鎖美晴「開心事件」
美晴晚餐約會 —
● 吃 → 美晴好感度 +1
● 謝絕 → 無好感度
美晴舅舅 —
● 疑惑 → 無好感度
● 自信一點 → 白虎幫助 +1
與綾瀨的訓練 —
● 使用能力 → 無好感度
● 不使用能力 → 繼續場景
閃避 —
● 是 / 不 → 劇情分歧
怎麼上 —
● 回想今天學習的 → 綾瀨好感度 +1
● 緊盯著她的表情 → 無好感度
向比奈自我介紹 —
● 搞笑 → 比奈幫助 +1
● 認真 → 綾瀨好感度 +1
野生的千佳 —
● 別打擾她 → 千佳路線結束
● 關心她 → 千佳好感度 +1,繼續路線
閃避攻擊 —
● 當頭迎擊 → 千佳父親 +1
● 閃避 → 無好感度
美晴新髮型 —
● 讚美她 → 美晴好感度 +1
● 沉默 → 無好感度
美晴讀書會 —
(需美晴好感度 ≥ 5 才能進入)
● 是 → 美晴自信提升
● 不 → 無好感度
V0.3結束
最大可能綾瀨好感度 = 9
最大可能美晴好感度 = 6
最大可能優花好感度 = 2
最大可能千佳好感度 = 5
最大可能香帆好感度 = 0
开始游戏
立即获取完整游戏体验